

Japan's core CPI normally means the nationwide consumer price index for all items less fresh food. It does not automatically mean "excluding food and energy," as it often does in US coverage. Japan's so-called core-core CPI usually excludes fresh food and energy, but readers should always check the full official series name before comparing an inflation number or drawing a Bank of Japan conclusion.
Key Takeaways
- In Japan, the Statistics Bureau commonly calls all items less fresh food the core CPI.
- All items less fresh food and energy removes a wider set of volatile components; it is often called core-core, but the full label matters more than the nickname.
- The Bank of Japan uses broader underlying-inflation indicators as well. A monthly CPI print is evidence, not a stand-alone policy signal.
- Check the nationwide release, the comparison period, the exact exclusions and the base year before comparing headlines.
Japan core CPI has a specific official meaning
The Statistics Bureau of Japan publishes several nationwide consumer-price indexes. In its English Q&A, it says the index for all items, less fresh food is often called the Core index. Fresh food is excluded because weather and other short-term conditions can make those prices move sharply.
Energy is not excluded from that official core measure. The Bureau also publishes all items, less fresh food and energy, which it says can help identify underlying price trends. A third, still narrower series removes food (except alcoholic beverages) and energy. That is why a headline that merely says "Japan core CPI" is incomplete without the series definition.
Swipe horizontally to view all columns.
| Official series | What is excluded | Coverage where all items = 10,000 | Best use | Source |
|---|---|---|---|---|
| All items | Nothing | 10,000 | Broad household-price headline | Statistics Bureau CPI Q&A |
| All items, less fresh food | Fresh food | 9,621 | Japan's commonly named core CPI | Statistics Bureau CPI Q&A |
| All items, less fresh food and energy | Fresh food; electricity, gas, liquefied propane, kerosene and gasoline | 8,872 | A wider exclusion-based underlying-inflation view | Statistics Bureau CPI Q&A |
| All items, less food (less alcoholic beverages) and energy | Food other than alcoholic beverages, plus energy | 6,609 | A still narrower reference series | Statistics Bureau CPI Q&A |
The coverage figures are weights in the index's reference table, not percentages of price inflation. They show why two series can move differently even in the same month: they deliberately cover different parts of the household basket.
Why fresh food and energy can change the story
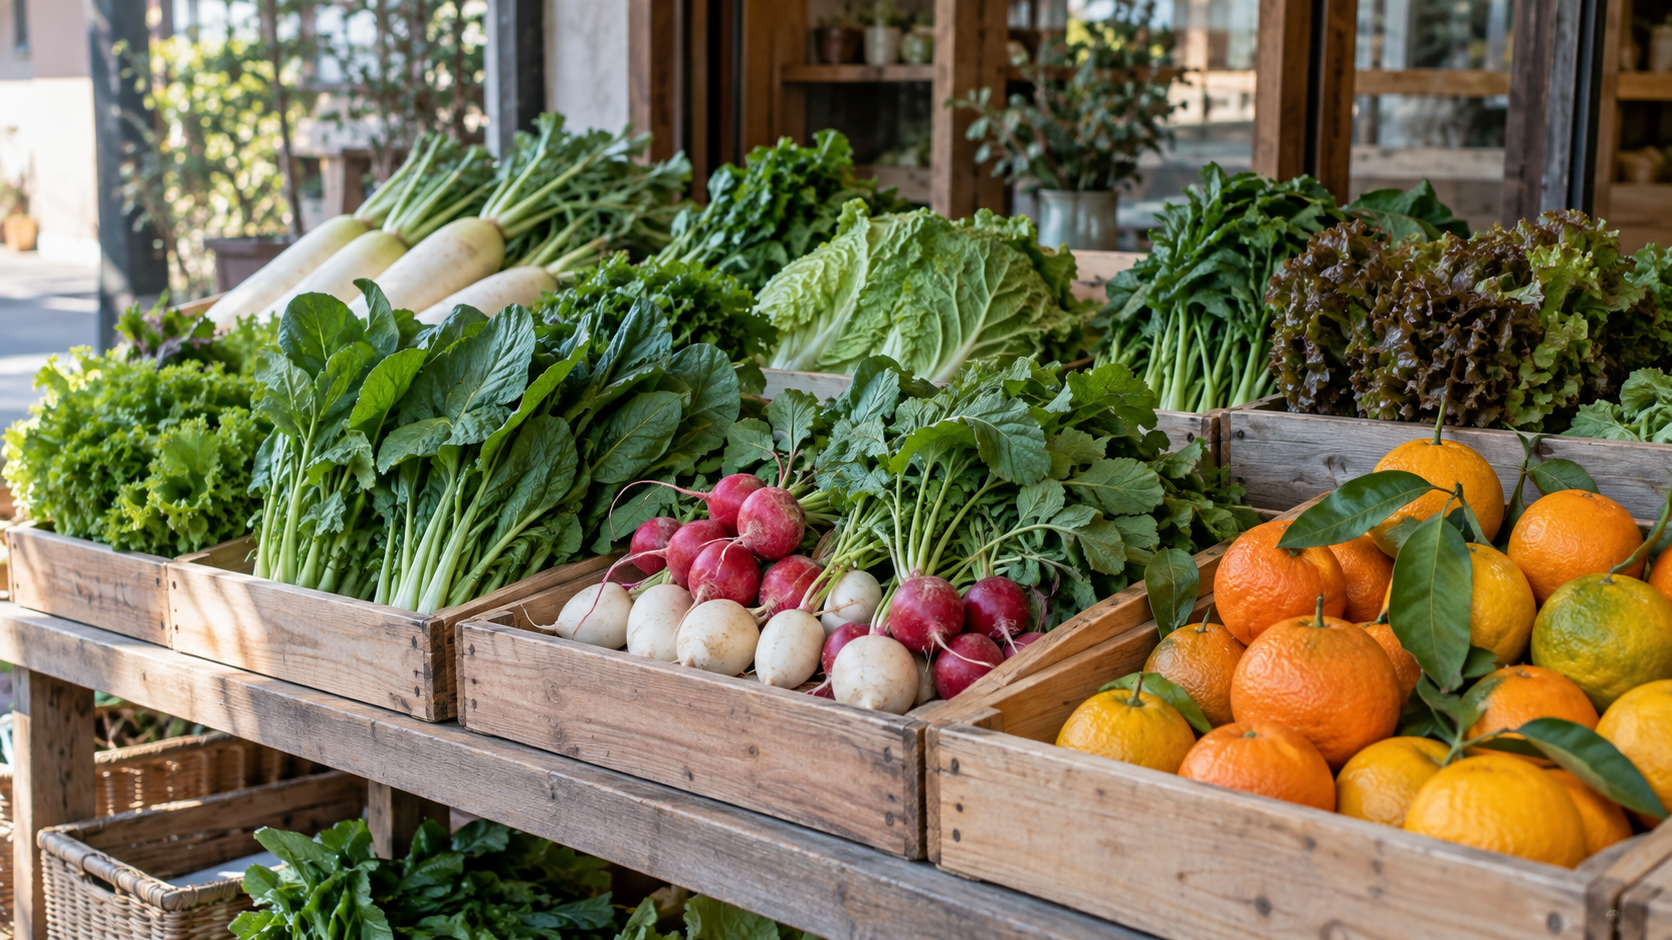
Fresh vegetables, fruit and fish can react quickly to weather and harvest conditions. Energy prices can also move with oil markets, exchange rates, regulated charges and government measures. Removing those components does not make a series more "true"; it answers a different question about the breadth and persistence of price changes.
For a simple historical orientation, the Statistics Bureau's published 2025 annual averages on the former 2020 base were 111.9 for all items, 111.2 for all items less fresh food, and 110.3 for all items less fresh food and energy. Their reported year-on-year changes were 3.2%, 3.1% and 3.0%, respectively. Those are annual-average illustrations, not a current-month forecast or a trading signal.
The practical reading rule is straightforward:
- Start with the full series name rather than the media shorthand.
- Note which excluded component explains the gap between the measures.
- Compare the same series with the same period a year earlier.
- Read a one-month movement alongside wages, services prices and the BOJ's broader indicators.

How the CPI is built — with a worked example
The Statistics Bureau first selects goods and services that matter in household spending, assigns weights using household-expenditure information, and then combines item price indexes. Prices are mainly collected through its monthly Retail Price Survey. The 2025-base revision says the current base is 2025 and that weights are principally based on average monthly household expenditure in 2025 for two-or-more-person households.
Readers usually see the result as a year-on-year percentage change. The calculation is:
Year-on-year CPI change = ((current-month index / index in the same month a year earlier) − 1) × 100
Hypothetical example — not reported CPI data: Suppose the all-items-less-fresh-food index is 110.4 in September this year and 107.2 in September last year. The calculation is ((110.4 / 107.2) − 1) × 100 = 2.99%, which would generally be reported as 3.0% year on year. The inputs use the same month to avoid treating normal seasonal differences as inflation.
Base-year changes deserve care, too. The Statistics Bureau began releasing the 2025-base CPI in August 2026 and says it released the new-base series retroactively from January 2025, while linked historical indexes support longer time-series work. Rates of change, however, are not simply recomputed from a linked series. Use the rate stated in the release when comparing official periods.

What the Bank of Japan reads beyond one core number
The BOJ's Indicators for Core CPI go beyond fixed exclusions. They include measures that remove institutional factors and measures based on the distribution of individual price changes, such as the trimmed mean and weighted median. The Bank says these indicators help identify underlying inflation alongside the output gap, labour-market tightness, inflation expectations and wage growth.
That is an important distinction for international readers: a higher core CPI print is not, by itself, proof that the BOJ must change policy. Nor does a lower core-core reading by itself show that broader household inflation has disappeared. The BOJ's 2% price-stability page states the target in terms of the year-on-year CPI rate, while its research pages show why policymakers examine composition and persistence as well.
A monthly Japan CPI release checklist
Use the Statistics Bureau's CPI portal as the starting point for the nationwide release, then apply this short sequence:
- Confirm whether the number is nationwide Japan or the preliminary Ku-area of Tokyo reading.
- Record the survey month, release date and whether the comparison is year on year or month on month.
- Copy the exact series name: all items, less fresh food, or less fresh food and energy.
- Check whether the report changed base-year presentation or revised a prior observation.
- Compare goods and services contributions where the release provides them; do not assume every move is energy-driven.
- Read the CPI beside the Japan Tankan business-confidence guide, Japan Shunto wage-negotiations guide and yen carry-trade guide for broader demand, wages and currency context.
The Bureau's published schedule lists nationwide September 2026 CPI for release on October 23, 2026. That timetable is useful for planning, but readers should use the linked data portal for the actual release and any revisions.
Sources
- Statistics Bureau of Japan — Q&A about the Consumer Price Index
- Statistics Bureau of Japan — Consumer Price Index portal
- Statistics Bureau of Japan — Main points of the 2025-base revision
- Statistics Bureau of Japan — CPI schedule of release
- Bank of Japan — Indicators for Core CPI
- Bank of Japan — Price Stability Target of 2 Percent
Disclaimer
This article is for informational purposes only and does not constitute investment advice.

