

Japan's June trade release gives global investors a useful warning about the country's 2026 recovery story. Exports looked strong on the surface, helped by semiconductors, integrated circuits and motor vehicles. But imports rose even faster, and the monthly balance returned to deficit. That mix matters because it separates Japan's real industrial momentum from the imported-cost pressure still moving through corporate margins and monetary-policy debates.
The Ministry of Finance's July 22 latest-release page published the full June 2026 provisional trade package and the January-June 2026 provisional calendar-year package. The headline is positive for exporters: June exports reached 10.929 trillion yen, up 19.3% from a year earlier. The harder part is that imports reached 11.336 trillion yen, up 25.4%, leaving a 406.9 billion yen deficit after a 122.3 billion yen surplus in June 2025.
Key Takeaways

- June exports rose 19.3% year on year, but imports rose 25.4%, so the monthly trade balance moved to a 406.9 billion yen deficit.
- The export story was led by semiconductors, integrated circuits and motor vehicles, not by a broad identical lift across every industrial line.
- Energy remains the pressure point: petroleum import value rose sharply even though petroleum import volume fell.
- The first half of 2026 still looks better than the monthly deficit suggests, with the January-June trade deficit down 57.0% year on year.
- For investors, the trade data are a margin test. Japanese exporters can benefit from demand and currency translation, while import-heavy companies remain exposed to fuel, components and procurement costs.
What The June Release Actually Says
MOF's trade statistics use free-on-board value for exports and cost, insurance and freight value for imports. That difference matters: imports include the cost of getting goods to Japan, so commodity and freight pressure can show up even when physical volumes are not rising at the same pace.
Swipe horizontally to view all columns.
| Indicator | June 2026 value | Year-on-year change | Definition and period | Source |
|---|---|---|---|---|
| Exports | 10.929 trillion yen | +19.3% | Customs value, free-on-board basis, June 2026 provisional | MOF June release |
| Imports | 11.336 trillion yen | +25.4% | Customs value, cost-insurance-freight basis, June 2026 provisional | MOF June release |
| Trade balance | -406.9 billion yen | Not meaningful | Exports minus imports; June 2025 balance was +122.3 billion yen | MOF June release |
| Seasonally adjusted exports | 10.553 trillion yen | Not shown in CSV | Reference series recomputed monthly through June 2026 | MOF seasonally adjusted CSV |
| Seasonally adjusted imports | 11.435 trillion yen | Not shown in CSV | Reference series recomputed monthly through June 2026 | MOF seasonally adjusted CSV |
The seasonally adjusted series points in the same direction as the headline release: imports were above exports in June. That does not make the month a recession signal. It does mean investors should avoid reading the export gain as a clean improvement in Japan's external position.
The Export Story Is Semiconductors Plus Autos
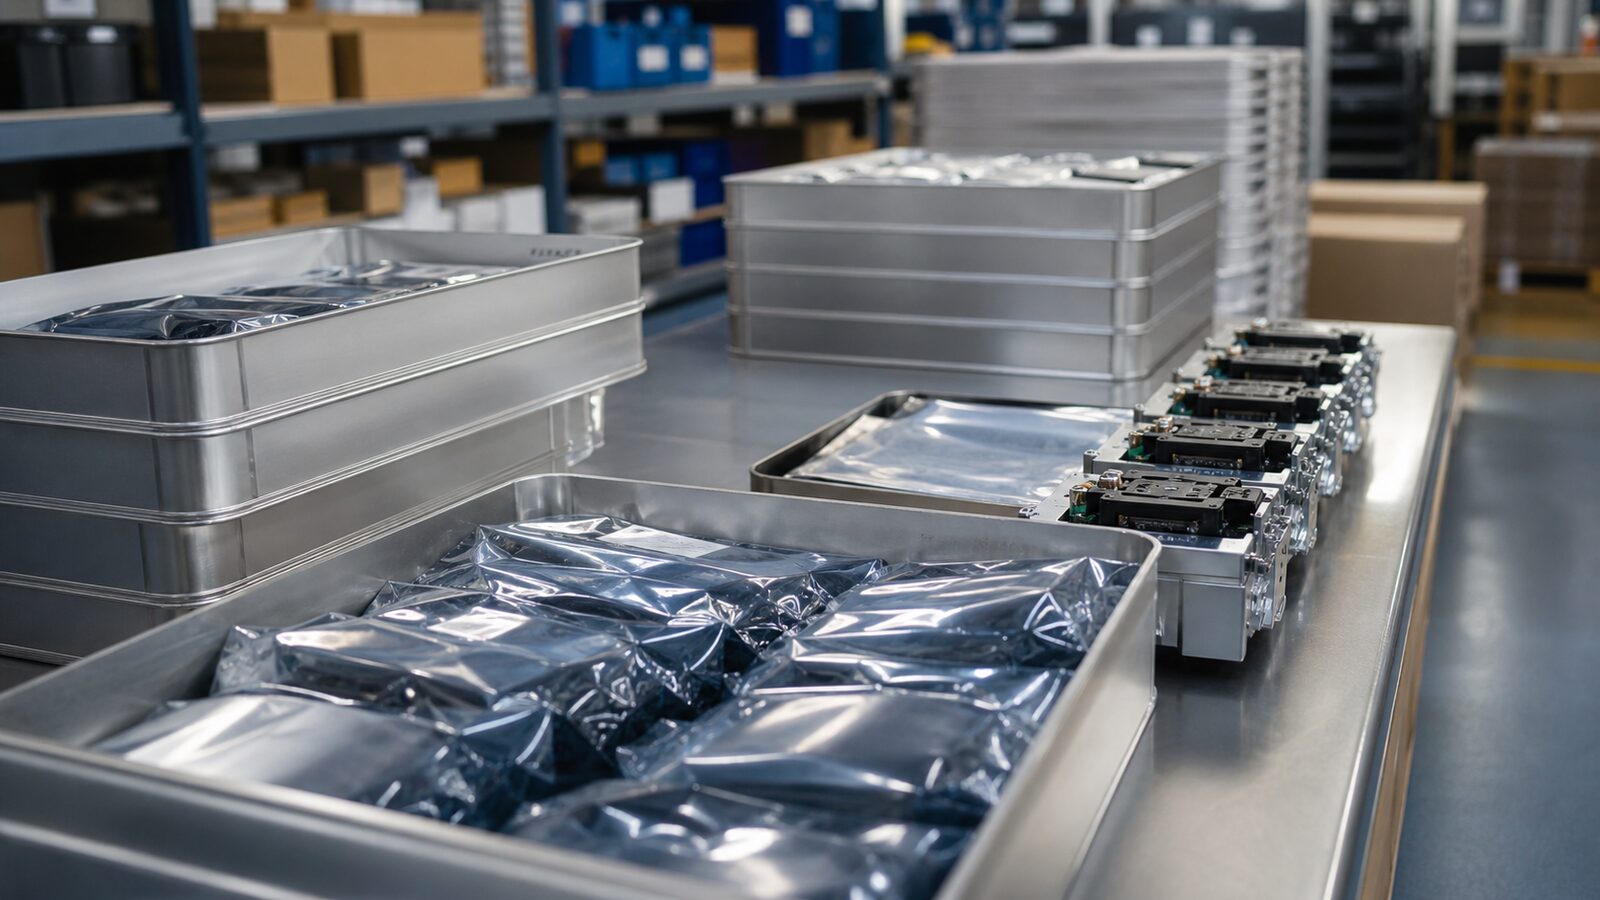
The most internationally relevant export lines were technology and autos. MOF's commodity table shows semiconductor-related exports rising much faster than total exports, while motor vehicles remained the largest single visible support for transport equipment.
Swipe horizontally to view all columns.
| Export item | June 2026 value | Year-on-year change | Share of exports | Contribution to export growth | Source |
|---|---|---|---|---|---|
| Semiconductors and related devices | 730.4 billion yen | +53.8% | 6.7% | 2.8 percentage points | MOF June commodity table |
| Integrated circuits | 543.5 billion yen | +58.8% | 5.0% | 2.2 percentage points | MOF June commodity table |
| Semiconductor manufacturing equipment | 460.1 billion yen | +18.7% | 4.2% | 0.8 percentage points | MOF June commodity table |
| Motor vehicles | 1.828 trillion yen | +23.0% | 16.7% | 3.7 percentage points | MOF June commodity table |
| Cars | 1.639 trillion yen | +24.6% | 15.0% | 3.5 percentage points | MOF June commodity table |
| Motor-vehicle parts | 313.8 billion yen | +0.6% | 2.9% | 0.0 percentage points | MOF June commodity table |
There is an important split inside the numbers. Semiconductor exports to Asia were 677.9 billion yen, up 57.7%, and integrated-circuit exports to Asia rose 60.2%. China semiconductor exports rose 77.5%, but semiconductor manufacturing equipment exports to China fell 10.2%. That is a reminder that the chip cycle is not one trade. Devices, tools, destinations and policy exposure can move differently.
Autos also require a careful read. Exports of motor vehicles to the United States were 564.0 billion yen, up 34.5%, while car exports to the United States were 549.7 billion yen, up 32.4%. Those figures support Japanese automakers' overseas revenue base, but they do not say much by themselves about unit profitability, incentives, tariffs, local production or currency hedging.
The Import Story Is Energy And Supply-Chain Depth

The import table explains why the trade balance did not improve despite the export rebound. Mineral-fuel imports were 2.102 trillion yen in June, up 42.0% from a year earlier. Petroleum was the clearest example of price pressure: import value rose 59.3% while import volume fell 13.7%.
Swipe horizontally to view all columns.
| Import item | June 2026 value | Year-on-year change | Quantity change | Share of imports | Source |
|---|---|---|---|---|---|
| Mineral fuels | 2.102 trillion yen | +42.0% | Not disclosed for category total | 18.5% | MOF June commodity table |
| Petroleum | 1.038 trillion yen | +59.3% | -13.7% | 9.2% | MOF June commodity table |
| LNG | 434.5 billion yen | +14.7% | +6.2% | 3.8% | MOF June commodity table |
| Coal | 304.8 billion yen | +46.8% | +10.2% | 2.7% | MOF June commodity table |
| Semiconductors and related devices | 554.1 billion yen | +49.2% | Not disclosed for item total | 4.9% | MOF June commodity table |
| Aircraft | 83.2 billion yen | +168.9% | Not disclosed | 0.7% | MOF June commodity table |
This is why Japan's trade data are useful for more than currency commentary. An exporter can report sales growth while still facing input-cost pressure. A utility, airline, retailer or materials user can face a very different earnings environment from an auto exporter or precision-equipment maker. The trade release makes that split visible before many company-level earnings reports do.
Why The First Half Matters

One month should not carry the whole story. The January-June release shows that Japan's first-half deficit was smaller than a year earlier even after the June setback. Exports in the first half rose 13.7% to 60.661 trillion yen. Imports rose 10.7% to 61.675 trillion yen. The first-half deficit was 1.014 trillion yen, down 57.0% year on year.
Swipe horizontally to view all columns.
| Item | January-June 2026 value | Year-on-year change | Definition and period | Source |
|---|---|---|---|---|
| Total exports | 60.661 trillion yen | +13.7% | Customs value, January-June 2026 provisional | MOF January-June release |
| Total imports | 61.675 trillion yen | +10.7% | Customs value, January-June 2026 provisional | MOF January-June release |
| Trade balance | -1.014 trillion yen | Deficit down 57.0% | Exports minus imports, January-June 2026 provisional | MOF January-June release |
| Semiconductor exports | 4.140 trillion yen | +41.1% | Commodity value, January-June 2026 provisional | MOF January-June release |
| Motor-vehicle exports | 9.294 trillion yen | +7.1% | Commodity value, January-June 2026 provisional | MOF January-June release |
| Mineral-fuel imports | 10.979 trillion yen | -3.1% | Commodity value, January-June 2026 provisional | MOF January-June release |
The first-half table keeps the June release in perspective. The external balance has improved from last year's first half, but the improvement is not immune to a month of energy-price pressure, aircraft imports, semiconductor import demand or exchange-rate effects.
The Company Read-Through
The Bank of Japan's June 2026 Tankan Outline, released July 1, gives useful context. Large manufacturers' business-conditions diffusion index rose to 22 in June from 17 in March, and their overseas supply-demand condition improved to -3 from -6. That supports the idea that exporters entered summer with better demand conditions.
The same survey also shows why the trade release should not be read as pure upside. Large manufacturers' input-price diffusion index jumped to 62 in June from 46 in March. All enterprises assumed 152.57 yen per U.S. dollar for fiscal 2026, compared with 150.10 in the March survey. A weaker yen can help translated overseas sales, but it can also raise imported fuel, parts and materials costs.
For company analysis, the June trade data therefore point to three questions. First, which exporters have real volume growth rather than only yen value growth? Second, which companies can pass through imported-cost pressure? Third, which manufacturers rely on imported chips, energy or aircraft-related inputs at the same time they benefit from overseas demand?
What To Watch Next
The next test is whether June was a one-month import-cost interruption or the start of a tougher second-half balance. Watch the July trade release for three items: whether semiconductor exports remain strong across Asia, whether petroleum and coal values stay elevated relative to quantities, and whether the U.S. auto-export value continues to outpace unit growth.
Investors should also compare the trade data with company earnings guidance. A manufacturer that cites overseas demand without discussing energy, components, hedging and pricing power is leaving out half the story. Japan's export rebound is real in the June data. The import bill is real as well.
Sources
- Ministry of Finance / Trade Statistics of Japan latest press release page, accessed July 22, 2026.
- MOF June 2026 provisional trade release, released July 22, 2026.
- MOF January-June 2026 provisional trade release, released July 22, 2026.
- MOF seasonally adjusted trade time series, accessed July 22, 2026.
- Bank of Japan Tankan Outline, June 2026, released July 1, 2026.
Disclaimer
This article is for informational purposes only and does not constitute investment advice.

