
Japanese trading houses stocks are often discussed as a single Japan-equities theme. That shortcut misses the useful question. Berkshire Hathaway's 2025 annual letter identified five Tokyo-listed general trading companies—Mitsubishi Corporation, ITOCHU Corporation, Mitsui & Co., Marubeni Corporation and Sumitomo Corporation—but their businesses, disclosures and risks are not interchangeable.
The practical starting point is to match each company to its Tokyo code, date every holding figure, then compare the operating and capital-allocation evidence company by company. Berkshire's disclosed market values are a snapshot at 31 December 2025, not a current quote or an investment conclusion.
Key takeaways
- Berkshire's 2025 annual letter lists five Japanese trading houses with a combined disclosed market value of $35.368 billion at 31 December 2025.
- The Tokyo codes are 8058 for Mitsubishi Corporation, 8001 for ITOCHU, 8031 for Mitsui, 8002 for Marubeni and 8053 for Sumitomo Corporation.
- A general trading company—often called a *sogo shosha*, meaning a diversified Japanese trading and business-investment group—is not a single commodity or currency bet.
- Use the five names as a research map: read segment mix, cash generation, capital allocation, balance-sheet exposure and foreign-exchange assumptions before comparing returns or dividends.
What a Japanese trading house is—and is not
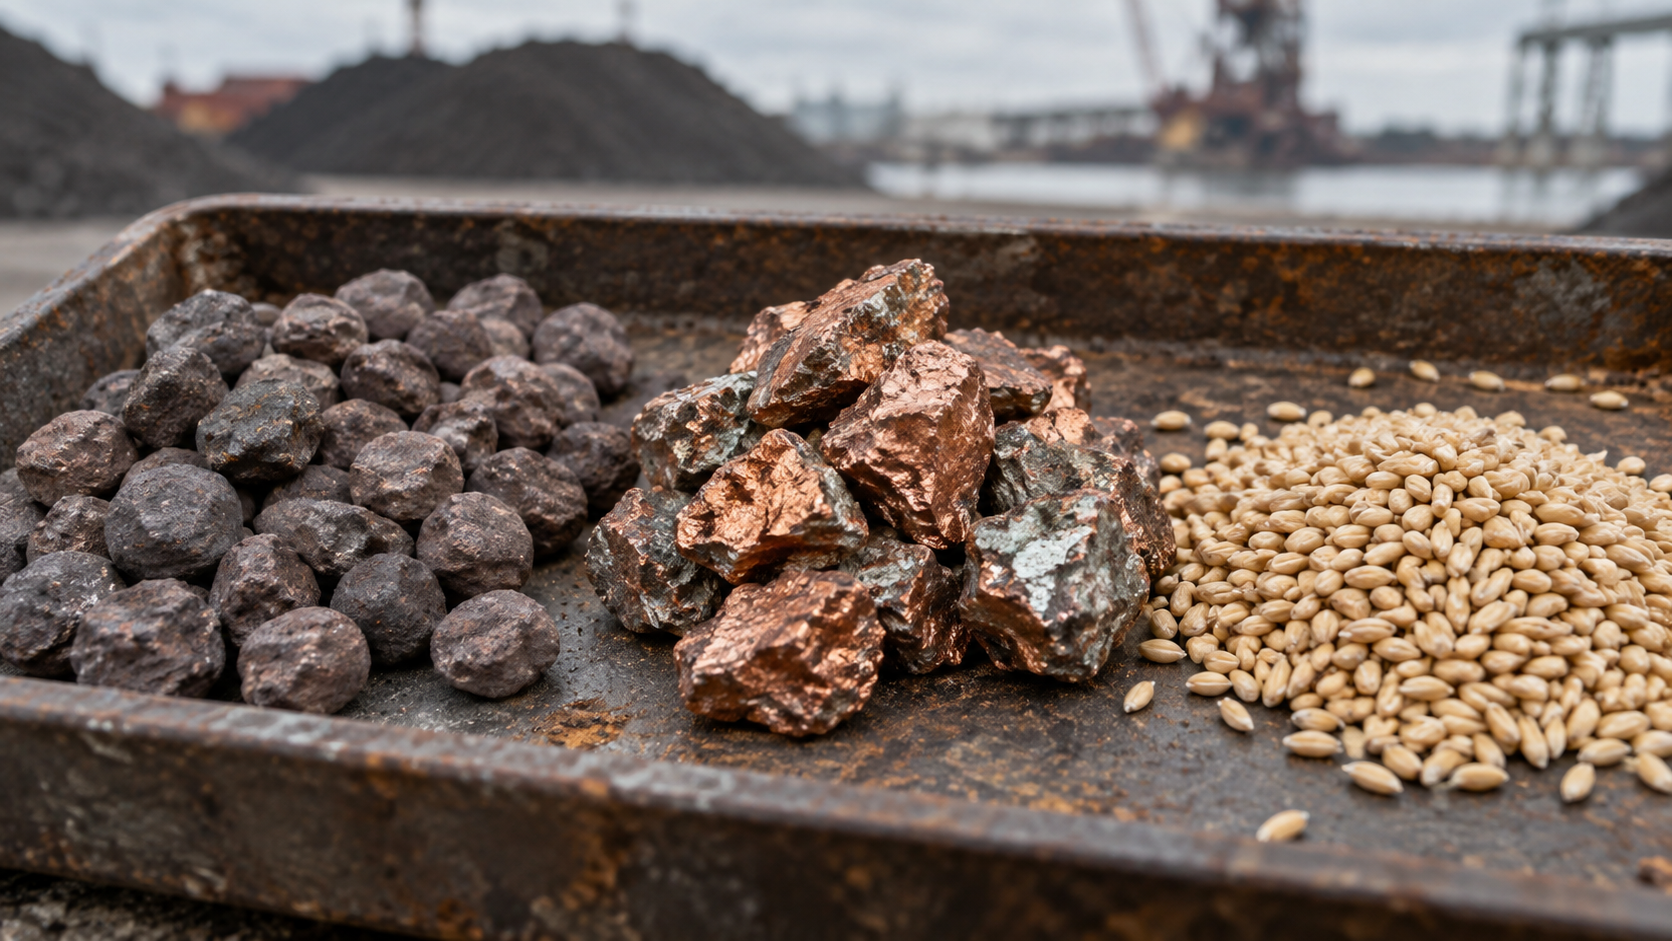
The label can sound narrower than the underlying businesses. These groups trade goods, arrange finance and logistics, and hold operating investments across many industries and geographies. Their results can therefore reflect a mix of resource prices, project execution, consumer demand, infrastructure, associate-company earnings, currencies and asset sales.
That is why a holder list is a starting point, not a thesis. For example, Mitsui's business overview lists seven operating segments spanning resources, energy, mobility and infrastructure, chemicals, food and other activities. Marubeni's current business page likewise lists divisions from food and agriculture to power, infrastructure, mobility and IT. Sumitomo's business-fields page covers automotive, infrastructure, digital, lifestyle, minerals, chemicals and energy transformation.
The useful comparison is therefore not “which trading house tracks one commodity?” It is: which disclosed businesses generate the earnings and cash, which investments matter most, and which assumptions management says can change the outcome?
For a broader guide to identifiers, see ATG Press's Japanese stock tickers, ADRs and TSE codes guide.
The five names and Tokyo codes
Berkshire Hathaway's 2025 annual letter provides a clear dated holder snapshot. The table below reproduces its Japan section, with Tokyo codes added as security identifiers. Dollar amounts are millions and apply to 31 December 2025.
Swipe horizontally to view all columns.
| Company | Tokyo code | Berkshire ownership | Berkshire cost basis | Berkshire market value | 2025 dividends received |
|---|---|---|---|---|---|
| Mitsubishi Corporation | 8058 | 10.8% | $4,248m | $9,207m | $273m |
| ITOCHU Corporation | 8001 | 10.1% | $4,165m | $8,886m | $181m |
| Mitsui & Co. | 8031 | 10.4% | $3,490m | $8,785m | $201m |
| Marubeni Corporation | 8002 | 9.8% | $1,572m | $4,468m | $105m |
| Sumitomo Corporation | 8053 | 9.7% | $1,907m | $4,022m | $102m |
| Total | — | — | $15,382m | $35,368m | $862m |
The codes identify the Tokyo ordinary shares. They do not establish whether a reader can trade those shares through a particular broker, whether an overseas symbol represents the same security, or what tax treatment applies. Those are separate custody, market-access and tax questions.
The annual letter also says Berkshire had borrowed in Japan an amount roughly equivalent to the yen invested at cost, at an average cost of 1.2% and a weighted-average life of about 5.75 years. That is a disclosure about Berkshire's financing as of the letter; it is not a company-level debt metric and should not be carried across to the five issuers.
A better way to compare the five companies
Start by treating the table as a lookup list, then build a like-for-like worksheet from each company's own results. A compact sequence works better than a broad label:
1. Map the business mix. Use the latest results presentation and integrated report to list the main earnings engines, investments and associates. Do not infer the mix from the company name. 2. Keep periods consistent. Compare annual figures with annual figures and quarterly figures with the same fiscal quarter. Japanese companies often have a March fiscal year-end, so a calendar-year comparison can silently mix periods. 3. Separate recurring and non-recurring items. Asset sales, revaluations, impairments, project milestones and equity-accounted earnings can all matter. Record the company definition before calculating a margin or growth rate. 4. Read capital allocation beside cash flow. A dividend, buyback, investment commitment or debt reduction has a different economic meaning. ATG Press's Japan shareholder-return-policy guide explains the main terms used in these decisions. 5. Read currency disclosures as assumptions. Translation effects, transaction exposure and forecast rates are different things. A weaker or stronger yen is not a universal answer for a diversified group.
This method also keeps Berkshire's ownership in proportion. The largest disclosed market-value line was Mitsubishi Corporation at $9.207 billion, roughly 26.0% of the five-company $35.368 billion total. That arithmetic describes Berkshire's reported Japan basket at the data date; it does not rank the companies by quality, attractiveness or expected return.
What to watch in the next filing cycle
The next set of company results is the appropriate place to update the comparison. For each issuer, record the reporting period first, then test five items:
- segment profit and the drivers management identifies;
- operating cash flow and the working-capital or investment movements behind it;
- material associate-company, resource, infrastructure or consumer-business disclosures;
- dividend, buyback, investment and balance-sheet actions; and
- changed commodity, currency, project or demand assumptions.
The objective is not to make five companies look identical. It is to identify where they genuinely differ and to leave figures as “not disclosed” when a company does not provide a comparable measure. That discipline is especially valuable when a globally recognized holder draws attention to a whole group of Japanese stocks at once.
For a company-specific example of capital-return reading, see ATG Press's Mitsui 8031 dividend and buyback guide.
Sources
- Berkshire Hathaway, 2025 Annual Letter, published February 2026; Japan-holdings data as of 31 December 2025; accessed 16 September 2026.
- Mitsui & Co., Our Business, accessed 16 September 2026.
- Marubeni Corporation, Our Business, accessed 16 September 2026.
- Sumitomo Corporation, Business Fields, accessed 16 September 2026.
- Tokyo Stock Exchange, Listed Companies, accessed 16 September 2026.
This article is for informational purposes only and does not constitute investment advice.

