
Canon’s latest reported sales are still led by Printing, not cameras. In the first half of 2026, Printing supplied 54% of consolidated external sales and roughly two-thirds of segment operating profit, while Imaging was the faster-growing and higher-margin business. Medical and Industrial are meaningful but smaller groups, each with a different operating issue to monitor.
For readers who search for Canon revenue by segment, the useful starting point is not a product list. It is the company’s four reported business groups—Printing, Medical, Imaging and Industrial—plus the corporate line. Canon Inc. is listed on the Tokyo Stock Exchange (TSE:7751), but its own FY2026 projection places 80% of sales outside Japan. This guide uses the latest completed half-year results, then keeps the company’s full-year projection in a separate lane.
Key takeaways

- Printing remained Canon’s largest business: first-half 2026 external sales were ¥1.238 trillion, or about 54% of consolidated sales.
- Imaging was the fastest-growing major group: external sales rose 16.9% year on year to ¥552.5 billion and operating profit rose 38.8% to ¥97.6 billion.
- Revenue share and profit share are not the same thing: Printing generated more segment profit in yen, but Imaging had the highest disclosed first-half segment operating margin at 17.7%, calculated from Canon’s reported figures.
- Medical was not a simple growth story: revenue slipped 0.8% and operating profit fell 29.2%; Canon attributed the supply delays to its production-system transition and a supplier disruption.
- FY2026 full-year numbers are company projections, not completed results: Canon forecasts ¥4.800 trillion in sales and ¥465.0 billion in operating profit. Its next scheduled results release is October 27, 2026.
Canon’s reported business mix: actual first-half data

Canon’s first-half 2026 financial results report ¥2.274542 trillion in consolidated sales and ¥230.595 billion in operating profit for January through June. The table below uses *external-customer* sales, which reconcile to Canon’s consolidated total. It deliberately excludes intersegment sales so that a reader does not double-count revenue moved between business groups.
Swipe horizontally to view all columns.
| Business group | What it broadly includes | First-half 2026 external sales | Year-on-year change | Share of consolidated sales* | First-half operating profit | ATG calculated operating margin** | Source |
|---|---|---|---|---|---|---|---|
| Printing | Office and commercial printing, printers and related products/services | ¥1,237.9B | +1.6% | 54.4% | ¥157.5B | 12.7% | Canon 1H 2026 results |
| Medical | Diagnostic imaging and healthcare-related systems | ¥276.9B | -0.8% | 12.2% | ¥8.3B | 3.0% | Canon 1H 2026 results |
| Imaging | Cameras, lenses, network cameras and video solutions | ¥552.5B | +16.9% | 24.3% | ¥97.6B | 17.7% | Canon 1H 2026 results |
| Industrial | Semiconductor/display lithography and manufacturing equipment | ¥143.6B | -9.1% | 6.3% | ¥17.4B | 12.0% | Canon 1H 2026 results |
| Others and Corporate | Other operations and corporate line | ¥63.6B | -10.0% | 2.8% | -¥50.0B | N/A | Canon 1H 2026 results |
| Consolidated total | All external-customer sales | ¥2,274.5B | +3.5% | 100.0% | ¥230.6B | 10.1% | Canon 1H 2026 results |
\* Share of consolidated sales is an ATG calculation using external-customer sales divided by Canon’s ¥2,274.542 billion consolidated sales for the same period; figures may not sum exactly because of rounding.
\** Operating margin is an ATG calculation using the business group’s reported operating profit divided by its reported *total* sales, including intersegment sales. This is a historical six-month ratio, not a forecast. The corporate line is not a comparable operating business, so no margin is presented.
The distinction between external sales and total segment sales matters. Canon also reports intersegment sales and then an elimination line in its segment statement. Adding the headline numbers from every row without that structure would overstate consolidated revenue.
For a broader guide to when Japanese companies issue these documents, see ATG Press’s Japan earnings season guide.
What moved in each business—and what it does not prove
Printing: Canon said in its 2Q/1H presentation that commercial-printing investment and office multifunction-device discussions improved as economic uncertainty began to ease. That helped lift first-half total Printing sales 1.5% and operating profit 5.0%. It remains the scale business, but the growth rate was much lower than Imaging’s.
Imaging: This group includes more than consumer cameras. Canon describes cameras as roughly 60% of Imaging sales in its Integrated Report 2026, alongside network cameras, video-management software and video-analytics applications. In the half-year presentation, Canon attributed strong performance to compact cameras, higher-priced full-frame models and network-camera demand tied to data-center and commercial-real-estate projects. That context helps explain why a company often identified with cameras can produce a different earnings mix than a camera-market headline suggests.
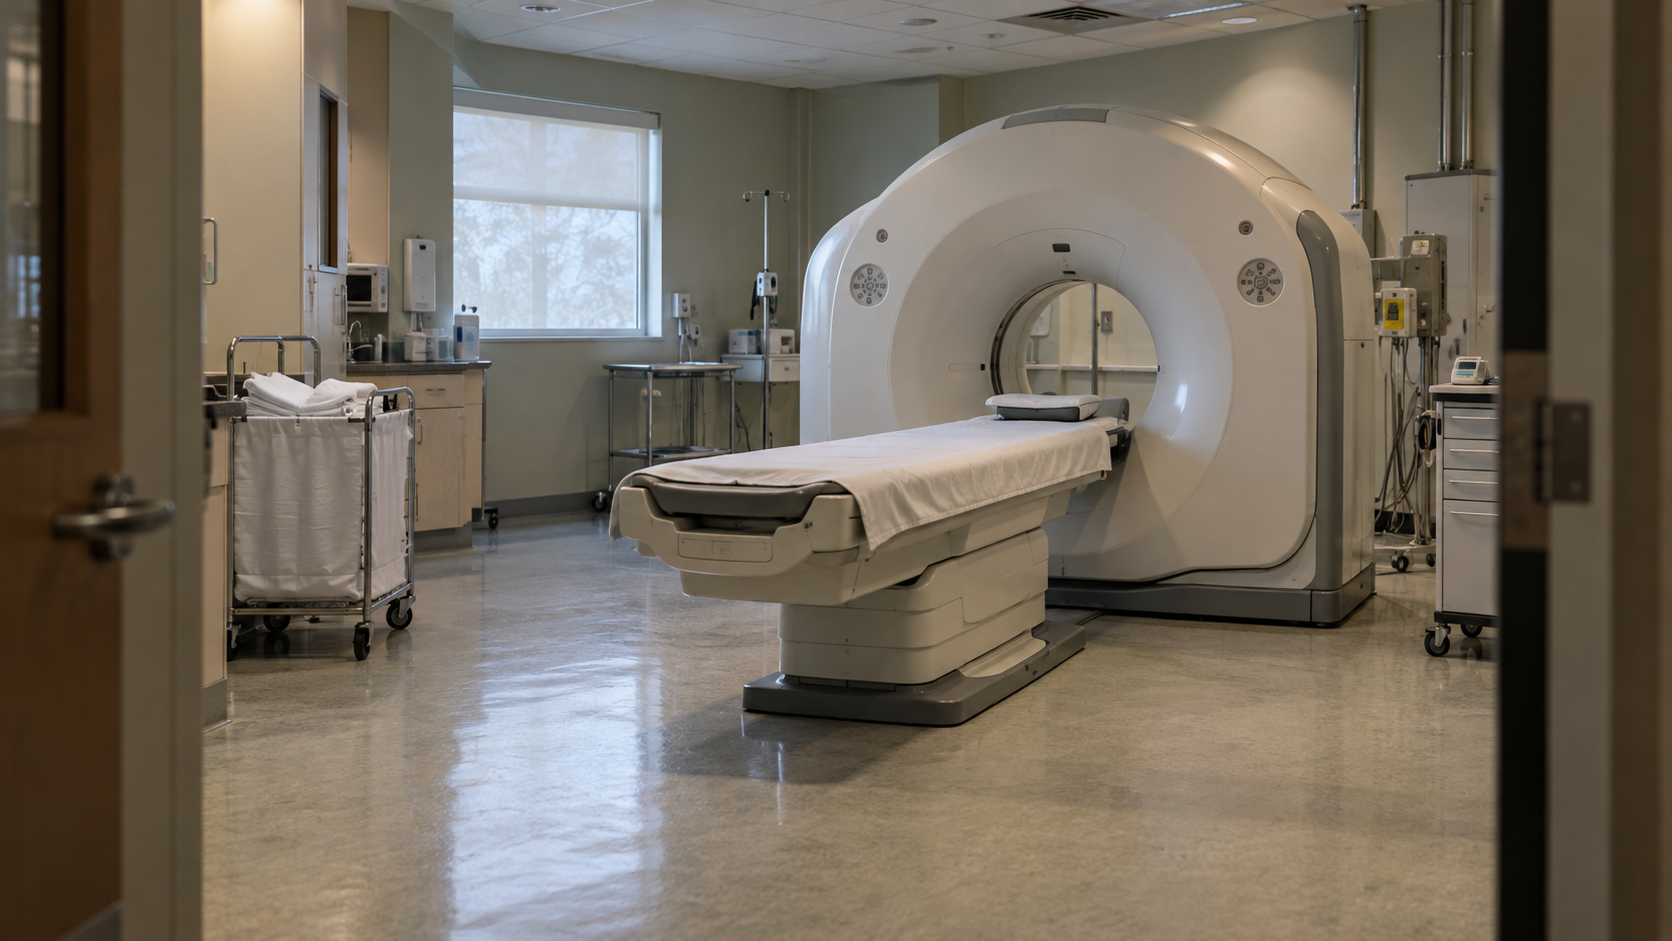
Medical: Canon reported in the same presentation that sales increased in some emerging markets on large orders but fell overall because of a production-system transition and a supplier disruption that delayed product supply. Medical therefore generated a ¥8.3 billion first-half operating profit, down from ¥11.8 billion a year earlier. The Integrated Report says Canon aims to improve the business’s profit ratio to 10% as soon as possible; that is a management goal, not evidence that the target will be reached.
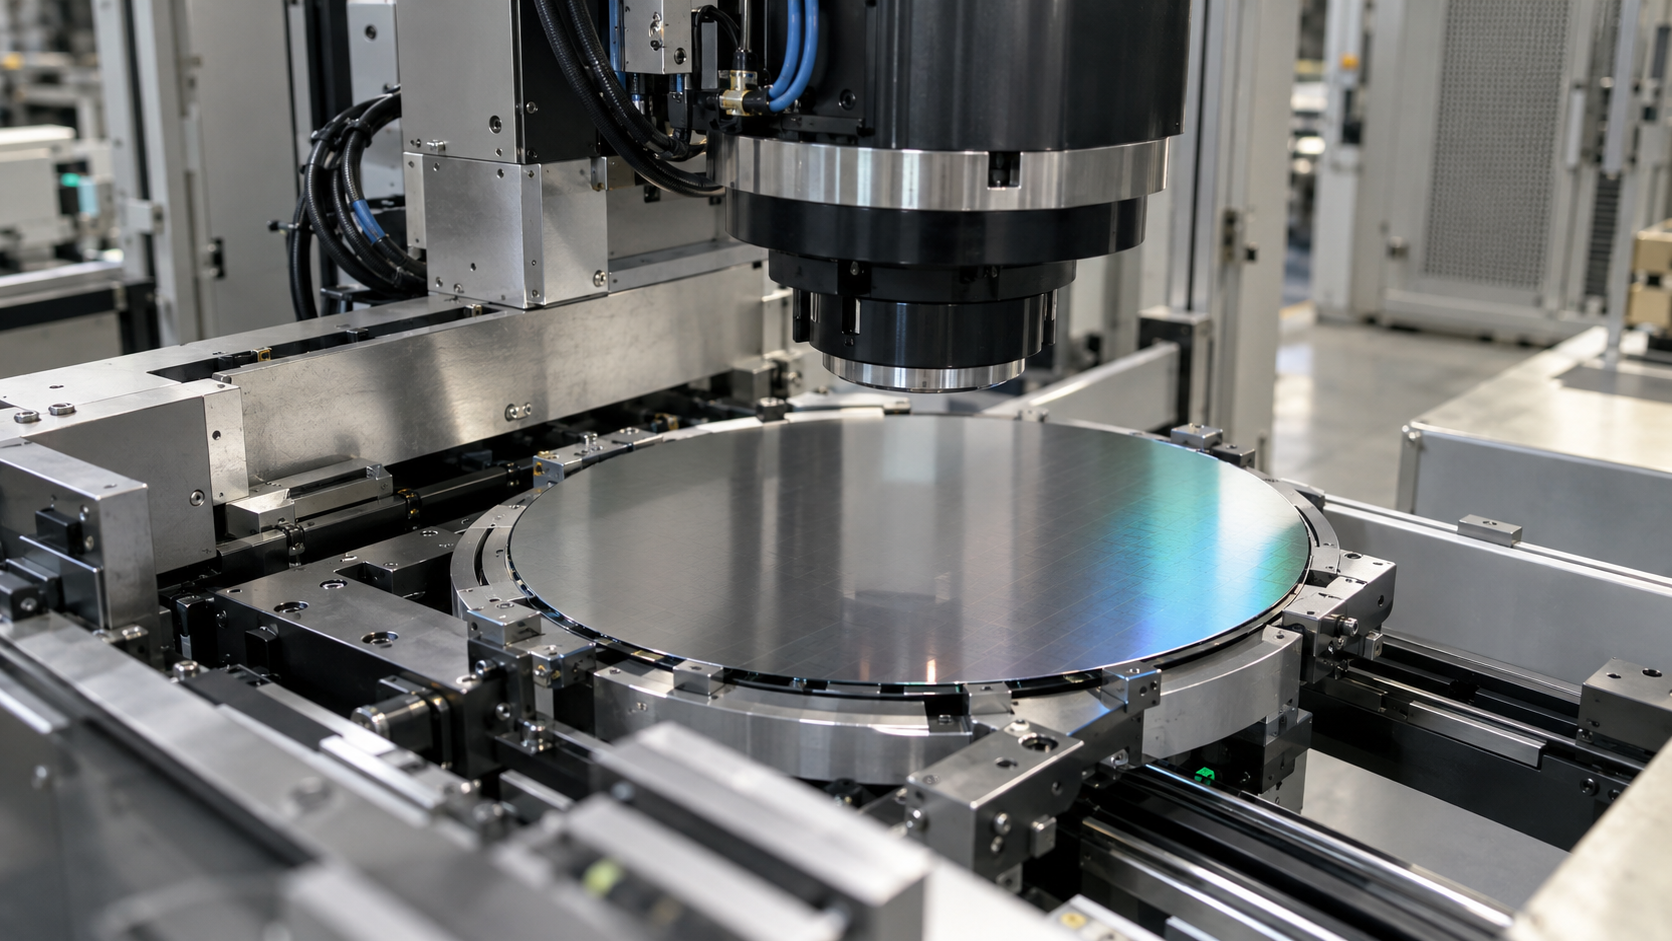
Industrial: Canon’s Industrial group includes semiconductor lithography, flat-panel-display lithography and other manufacturing equipment. Its half-year presentation says sales and profit declined as display-equipment customers postponed investment decisions, even though semiconductor-lithography sales grew. For readers mapping Japan’s equipment ecosystem, ATG Press’s Japanese semiconductor stocks research guide provides a separate sector starting point.
The central analytical point is simple: Printing is still the volume base, Imaging led first-half growth and margin, while Medical and Industrial each had disclosed execution or cycle-related constraints. Those observations describe one completed half-year; they do not establish a future earnings path.
FY2026 projection: a useful map, not a completed result
Canon’s Sales by Business Unit page, last updated with the July results, projects ¥4.800 trillion of FY2026 sales. The company projects Printing at 53% of sales and Imaging at 25%. The table is useful for mapping the scale Canon expects by year-end, but every FY2026 entry below remains management guidance as of October 12, 2026.
Swipe horizontally to view all columns.
| Business group | FY2025 actual sales | FY2026 company projection | FY2026 projected mix | Status |
|---|---|---|---|---|
| Printing | ¥2,494.4B | ¥2,544.2B | 53% | Company projection |
| Medical | ¥580.6B | ¥568.2B | 12% | Company projection |
| Imaging | ¥1,054.9B | ¥1,201.5B | 25% | Company projection |
| Industrial | ¥361.1B | ¥353.7B | 7% | Company projection |
| Others and Corporate | ¥237.1B | ¥241.3B | 5% | Company projection |
| Eliminations | -¥103.4B | -¥108.9B | -2% | Company projection |
| Total | ¥4,624.7B | ¥4,800.0B | 100% | Company projection |
Canon’s geographic-sales projection underscores why this is a Japan-connected global company rather than a domestic-only story: the company projects 20% of FY2026 sales in Japan, 32% in the Americas, 27% in Europe and 21% in Asia and Oceania. Those are projected sales shares, not a measure of where profits or manufacturing are located.
The company’s July presentation raised its FY2026 sales projection to ¥4.800 trillion and operating-profit projection to ¥465.0 billion. It also listed foreign exchange, tariff refunds, memory costs, the Middle East situation and cost reductions among the factors affecting its outlook. None is a reason to treat the guidance as assured.
How to read the next Canon release
Canon’s IR calendar says third-quarter 2026 results are scheduled for October 27 at 15:30 Tokyo time. A practical update checklist is:
1. Start with the reported period. Check whether a figure is third-quarter-only, nine-month cumulative, historical or a revised full-year projection. 2. Use external sales for the mix. They reconcile to consolidated revenue; do not sum segment totals without considering intersegment sales and eliminations. 3. Read sales and operating profit together. Revenue growth alone does not show whether a group’s operating contribution improved. 4. Separate company targets from results. Canon’s 2030 imaging and industrial ambitions, and its medical margin goal, are strategy statements—not completed financial results. 5. Trace the business driver. Printing, Imaging, Medical and Industrial respond to different customer and investment cycles. A group result should not be treated as a verdict on every Canon product line.
The chart is contextual only and may display delayed market data. It does not verify Canon’s segment sales, operating profit or guidance; those claims come from the company’s official disclosures cited above.
Sources
- Canon: Consolidated Financial Results for the Six Months Ended June 30, 2026 (PDF) — official first-half financial statements, segment data, cash flow and FY2026 forecast; released 2026-07-27; accessed 2026-10-12.
- Canon: 2Q/1H 2026 Presentation Material and Speech Summary (PDF) — official segment commentary, revised FY2026 outlook and risk factors; released 2026-07-27; accessed 2026-10-12.
- Canon: Sales by Business Unit — official FY2025 actual and FY2026 projected segment mix; last updated 2026-07-27; accessed 2026-10-12.
- Canon: Sales by Geographic Area — official FY2026 projected geographic sales mix; last updated 2026-07-27; accessed 2026-10-12.
- Canon Integrated Report 2026 (PDF) — official descriptions and strategy context for the company’s business groups; published 2026-04; accessed 2026-10-12.
- Canon IR Events — official third-quarter 2026 release schedule; accessed 2026-10-12.
Disclaimer
This article is for informational purposes only and does not constitute investment advice. Company guidance, product demand, foreign exchange, input costs, tariffs and market data can change; verify current primary disclosures before making an investment decision.

